Helping customers choose the right breakdown cover
Customers weren’t abandoning checkout because they didn’t want breakdown cover — they were getting stuck much earlier, at the moment they had to decide which cover actually fit their lives.
This case study shows how I used low-risk experimentation to reduce decision friction at that point, improving progression by +4.1% and +5.3% CTR, while protecting downstream conversion and consumer duty requirements.
At a glance
This work focused on improving one of the most fragile moments in the funnel — the first real decision customers had to make.
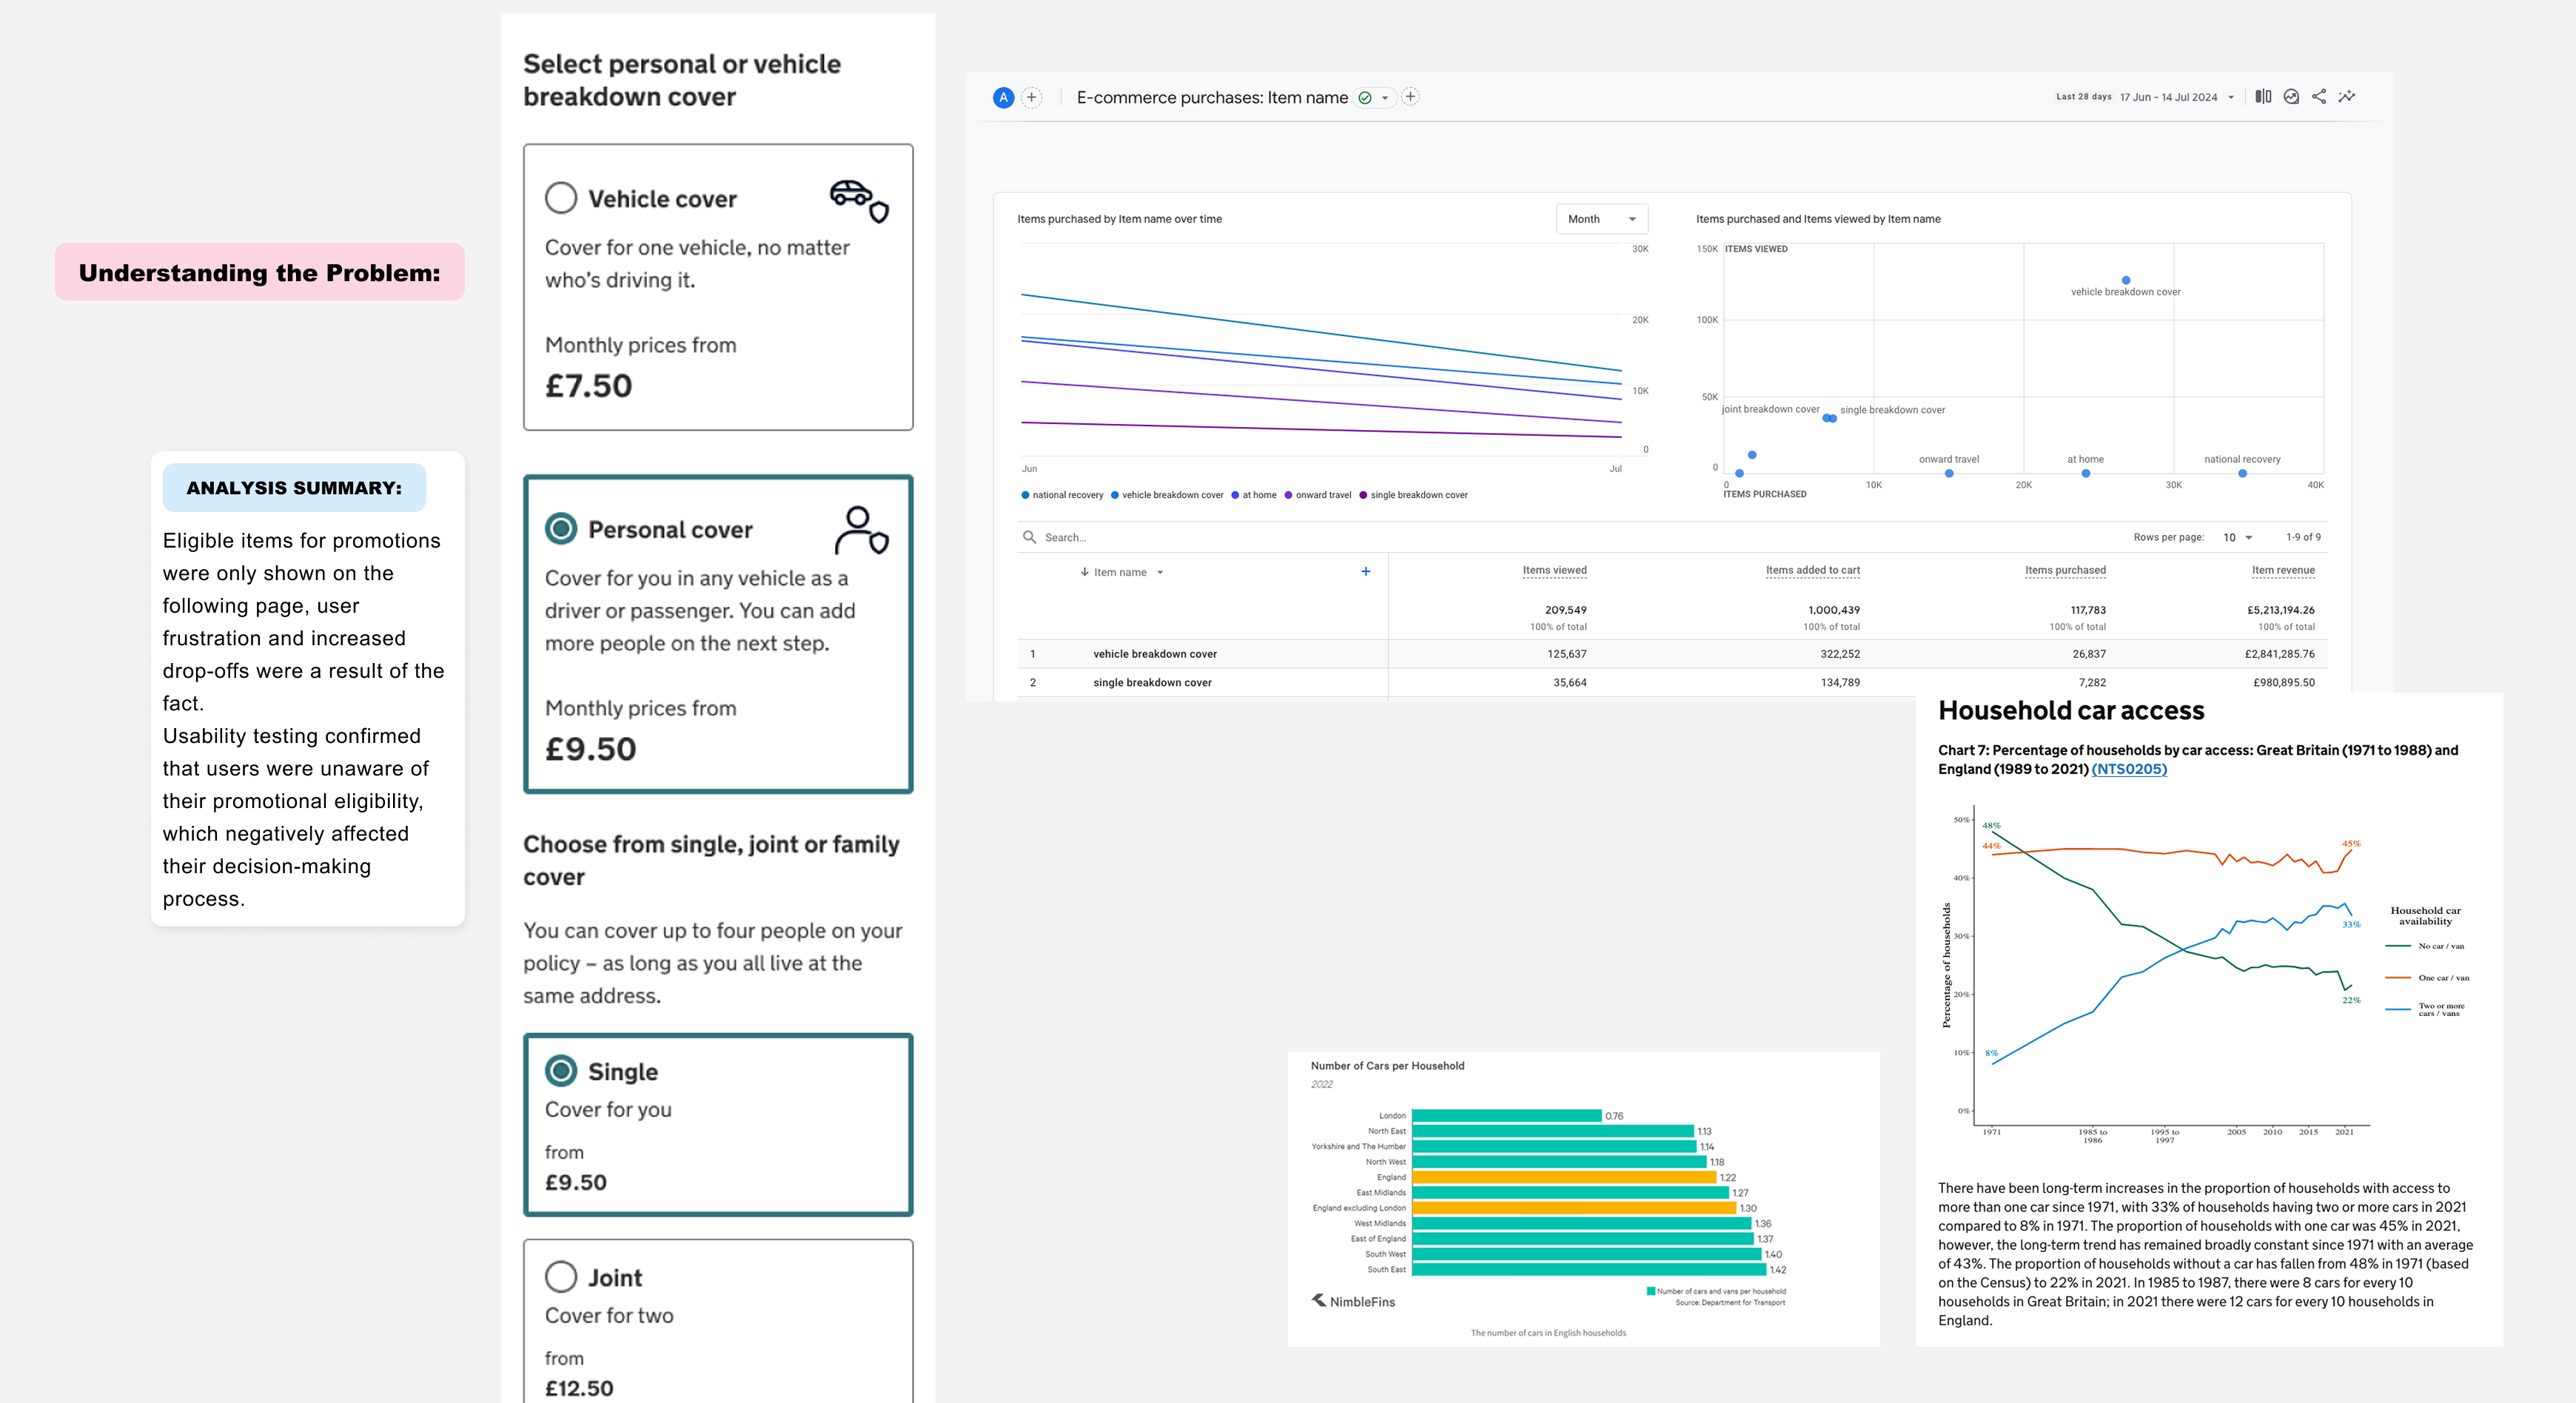
Problem
Customers were dropping off during cover type selection.
Solution
Iterative UX exploration and A/B testing to reduce decision friction.
Impact
+4.1% and +5.3% CTR uplift (≥97% significance).
Why this mattered
This experiment sat inside a high-traffic, regulated funnel, where even small changes carry commercial and ethical risk.
- Primary metric: Click-through rate (CTR) at cover type selection
- Secondary indicators: Conversion rate (CR), revenue per visitor (RPV), average transaction value (ATV)
- Constraints: Tight test window, existing platform limitations, high-traffic and commercially sensitive funnel
- Experimental results: CTR uplift of a relative +4.1% and +5.3% versus control, both statistically significant (≥97%)
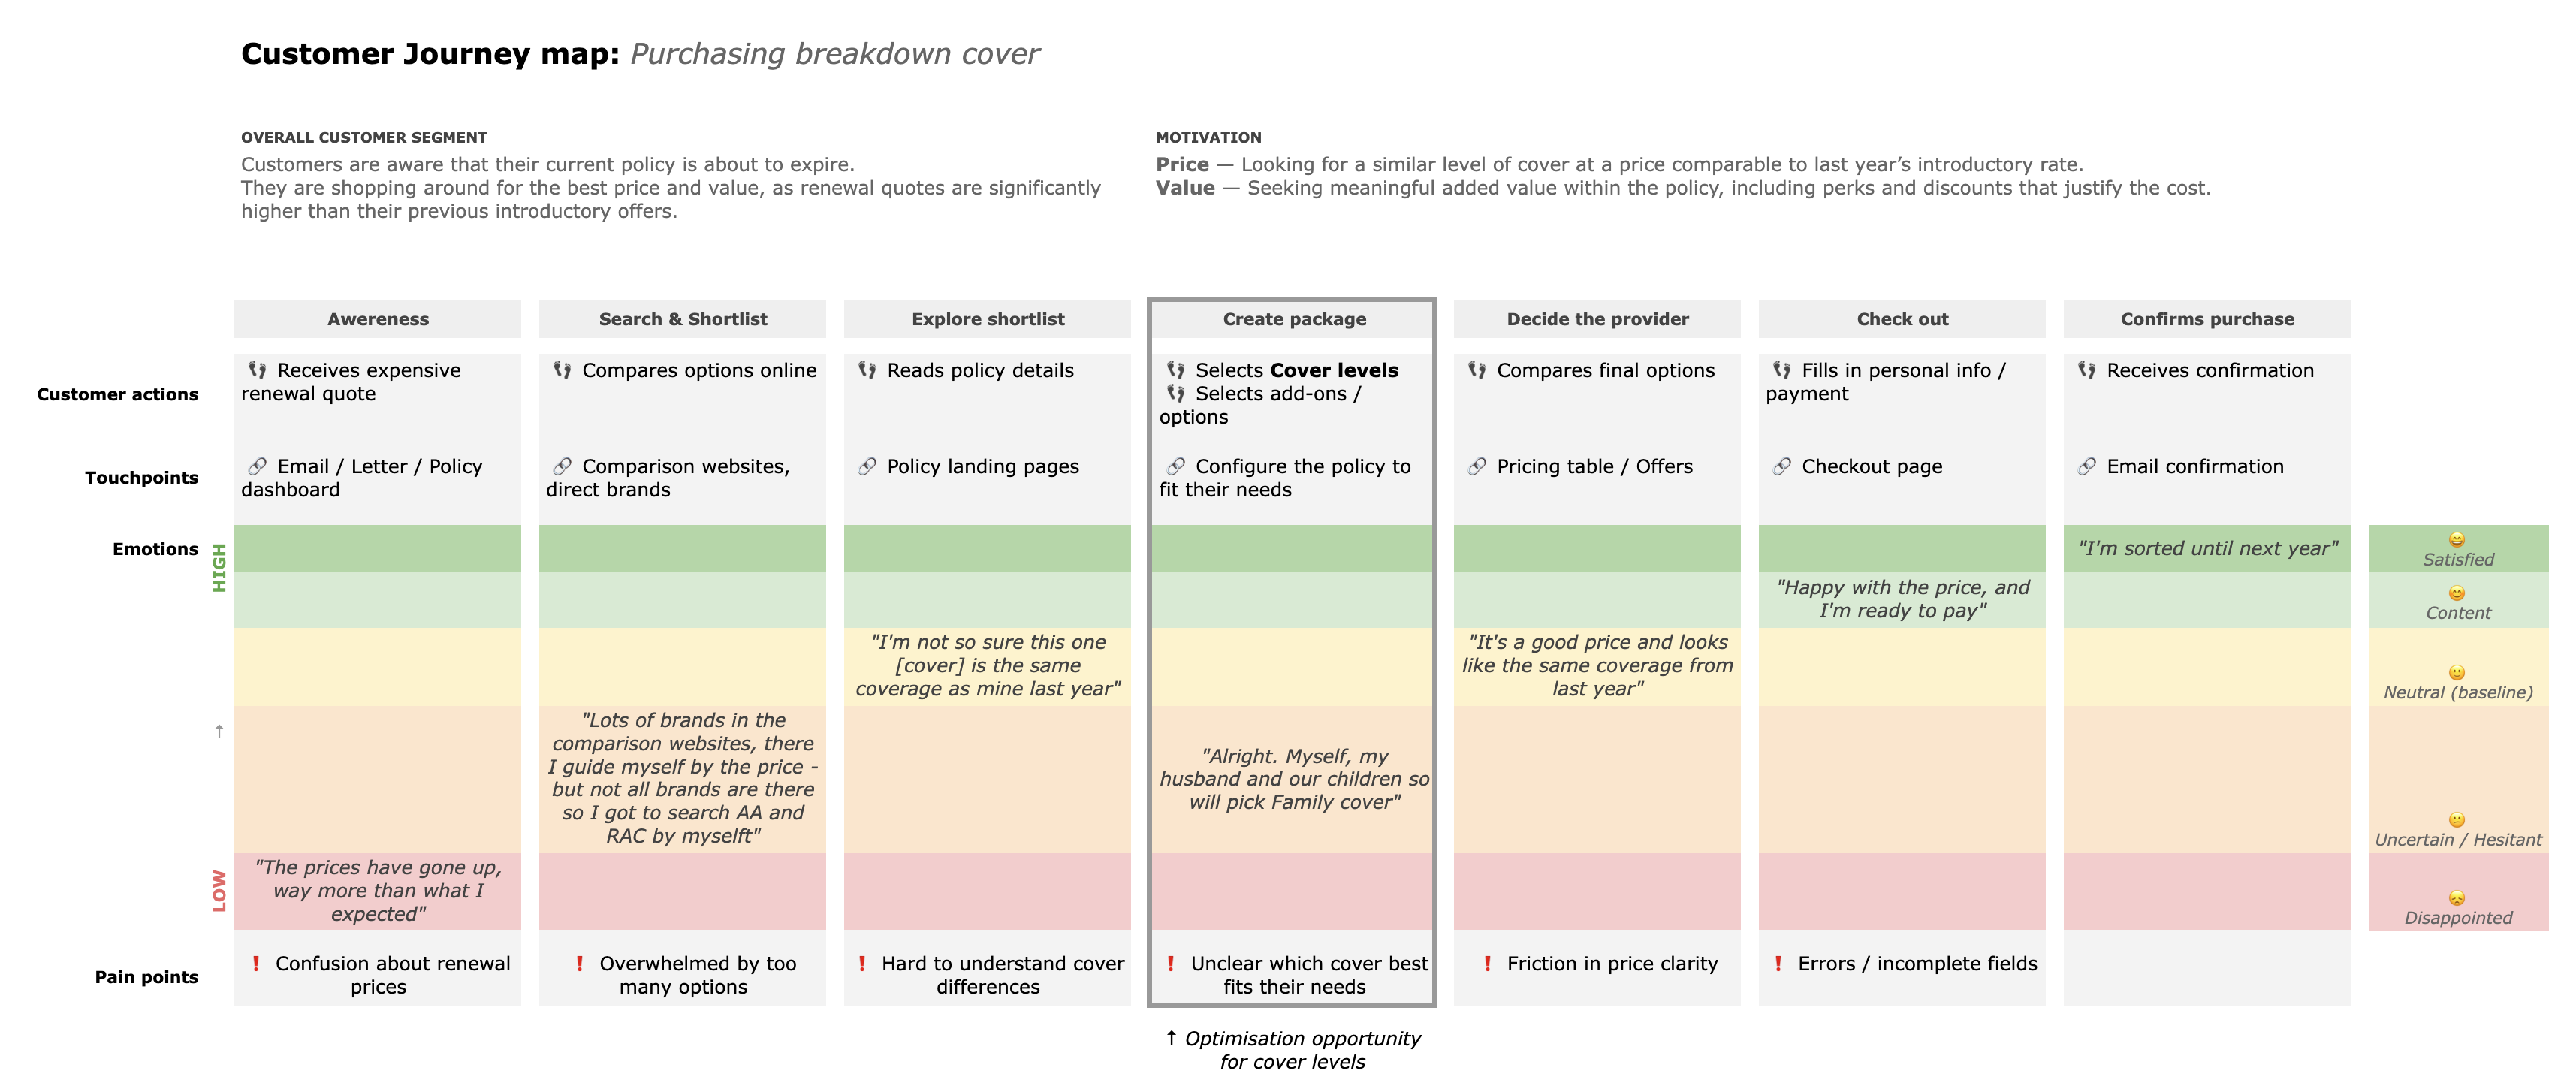
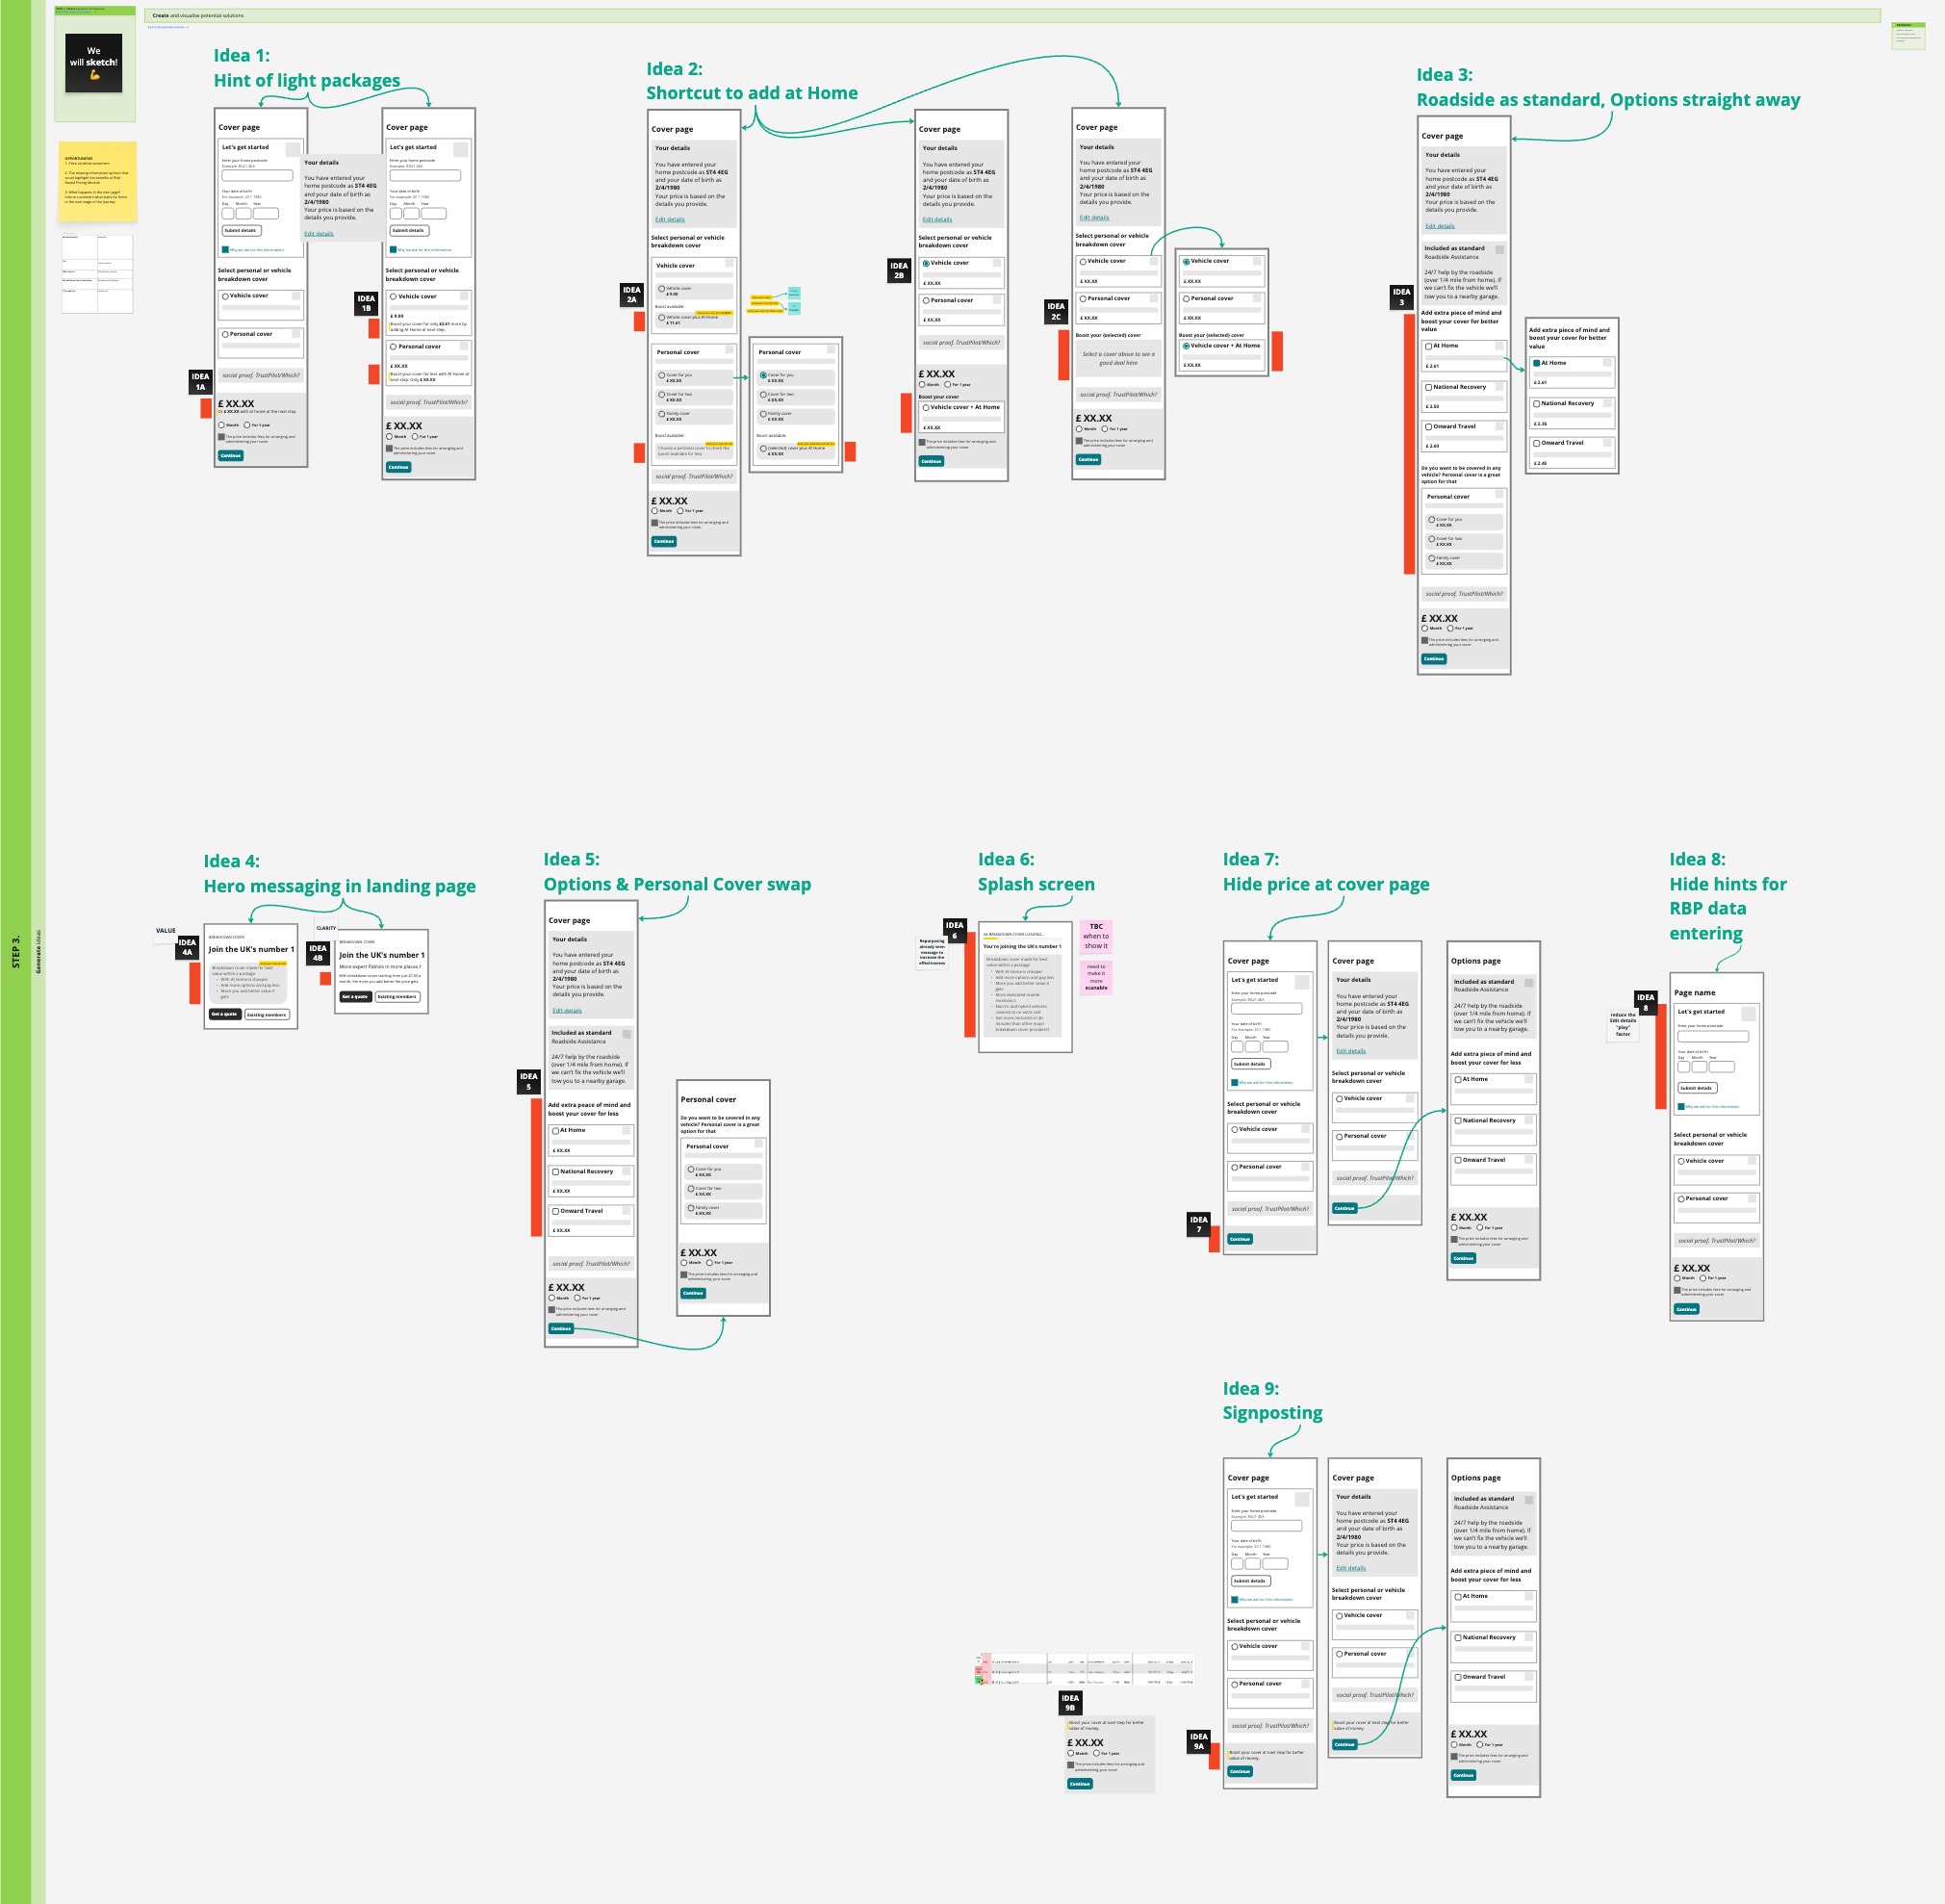
Defining the problem without over-correcting
A full redesign wasn’t viable — the risk was too high and the learning too diffuse. The strategy was to make incremental, testable changes that revealed how customers actually reasoned about cover.
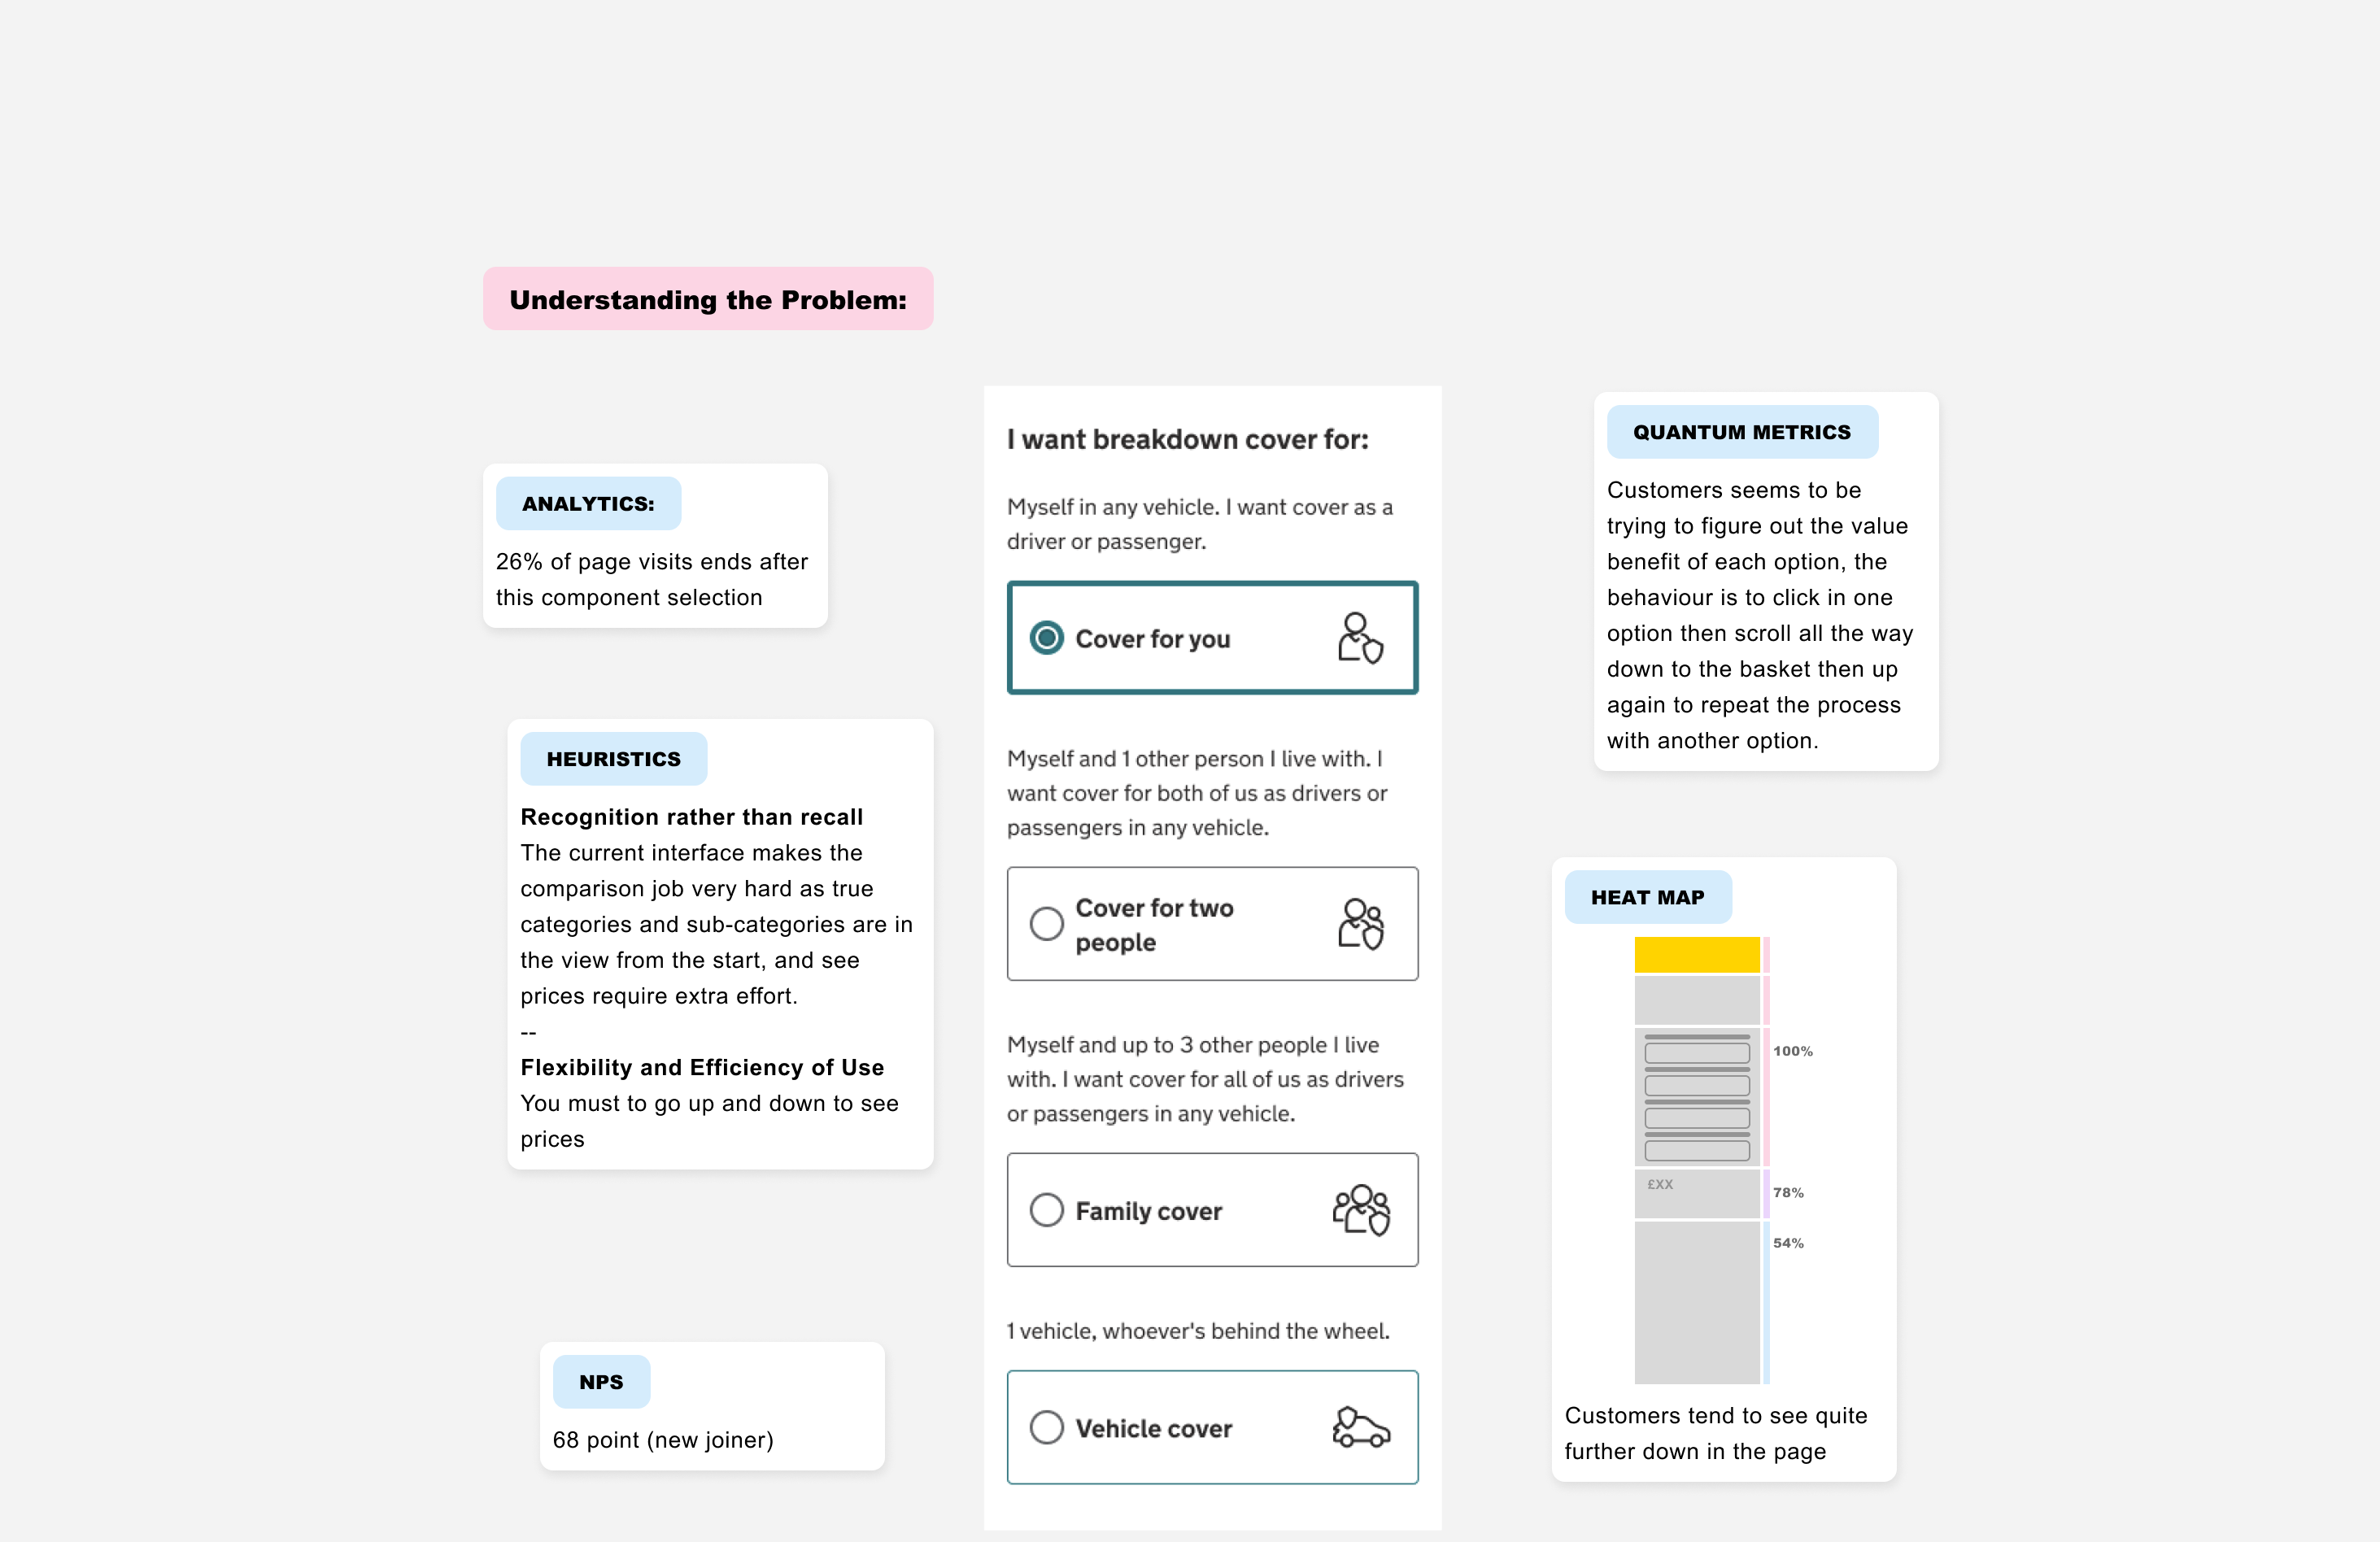
The problem we needed to solve
- Potential customers dropped off at a critical decision point in the funnel.
- Uncertainty around cover types, not intent, was driving hesitation.
The constraints
- High-traffic, commercially sensitive funnel.
- Redesign risk outweighed potential learning.
The approach
- Established CTR baseline metrics.
- Identified friction points in the cover type selection flow.
- Generated hypotheses around CTA, microcopy, and layout.
- Ran sequential A/B tests, using learnings to inform each iteration.
- Combined quantitative results with qualitative signals.
Key Design Decisions
Each iteration intentionally solved one source of friction at a time, trading visual perfection for clean learnings. Strategic decisions balanced speed of iteration, user clarity, and measurable outcomes:
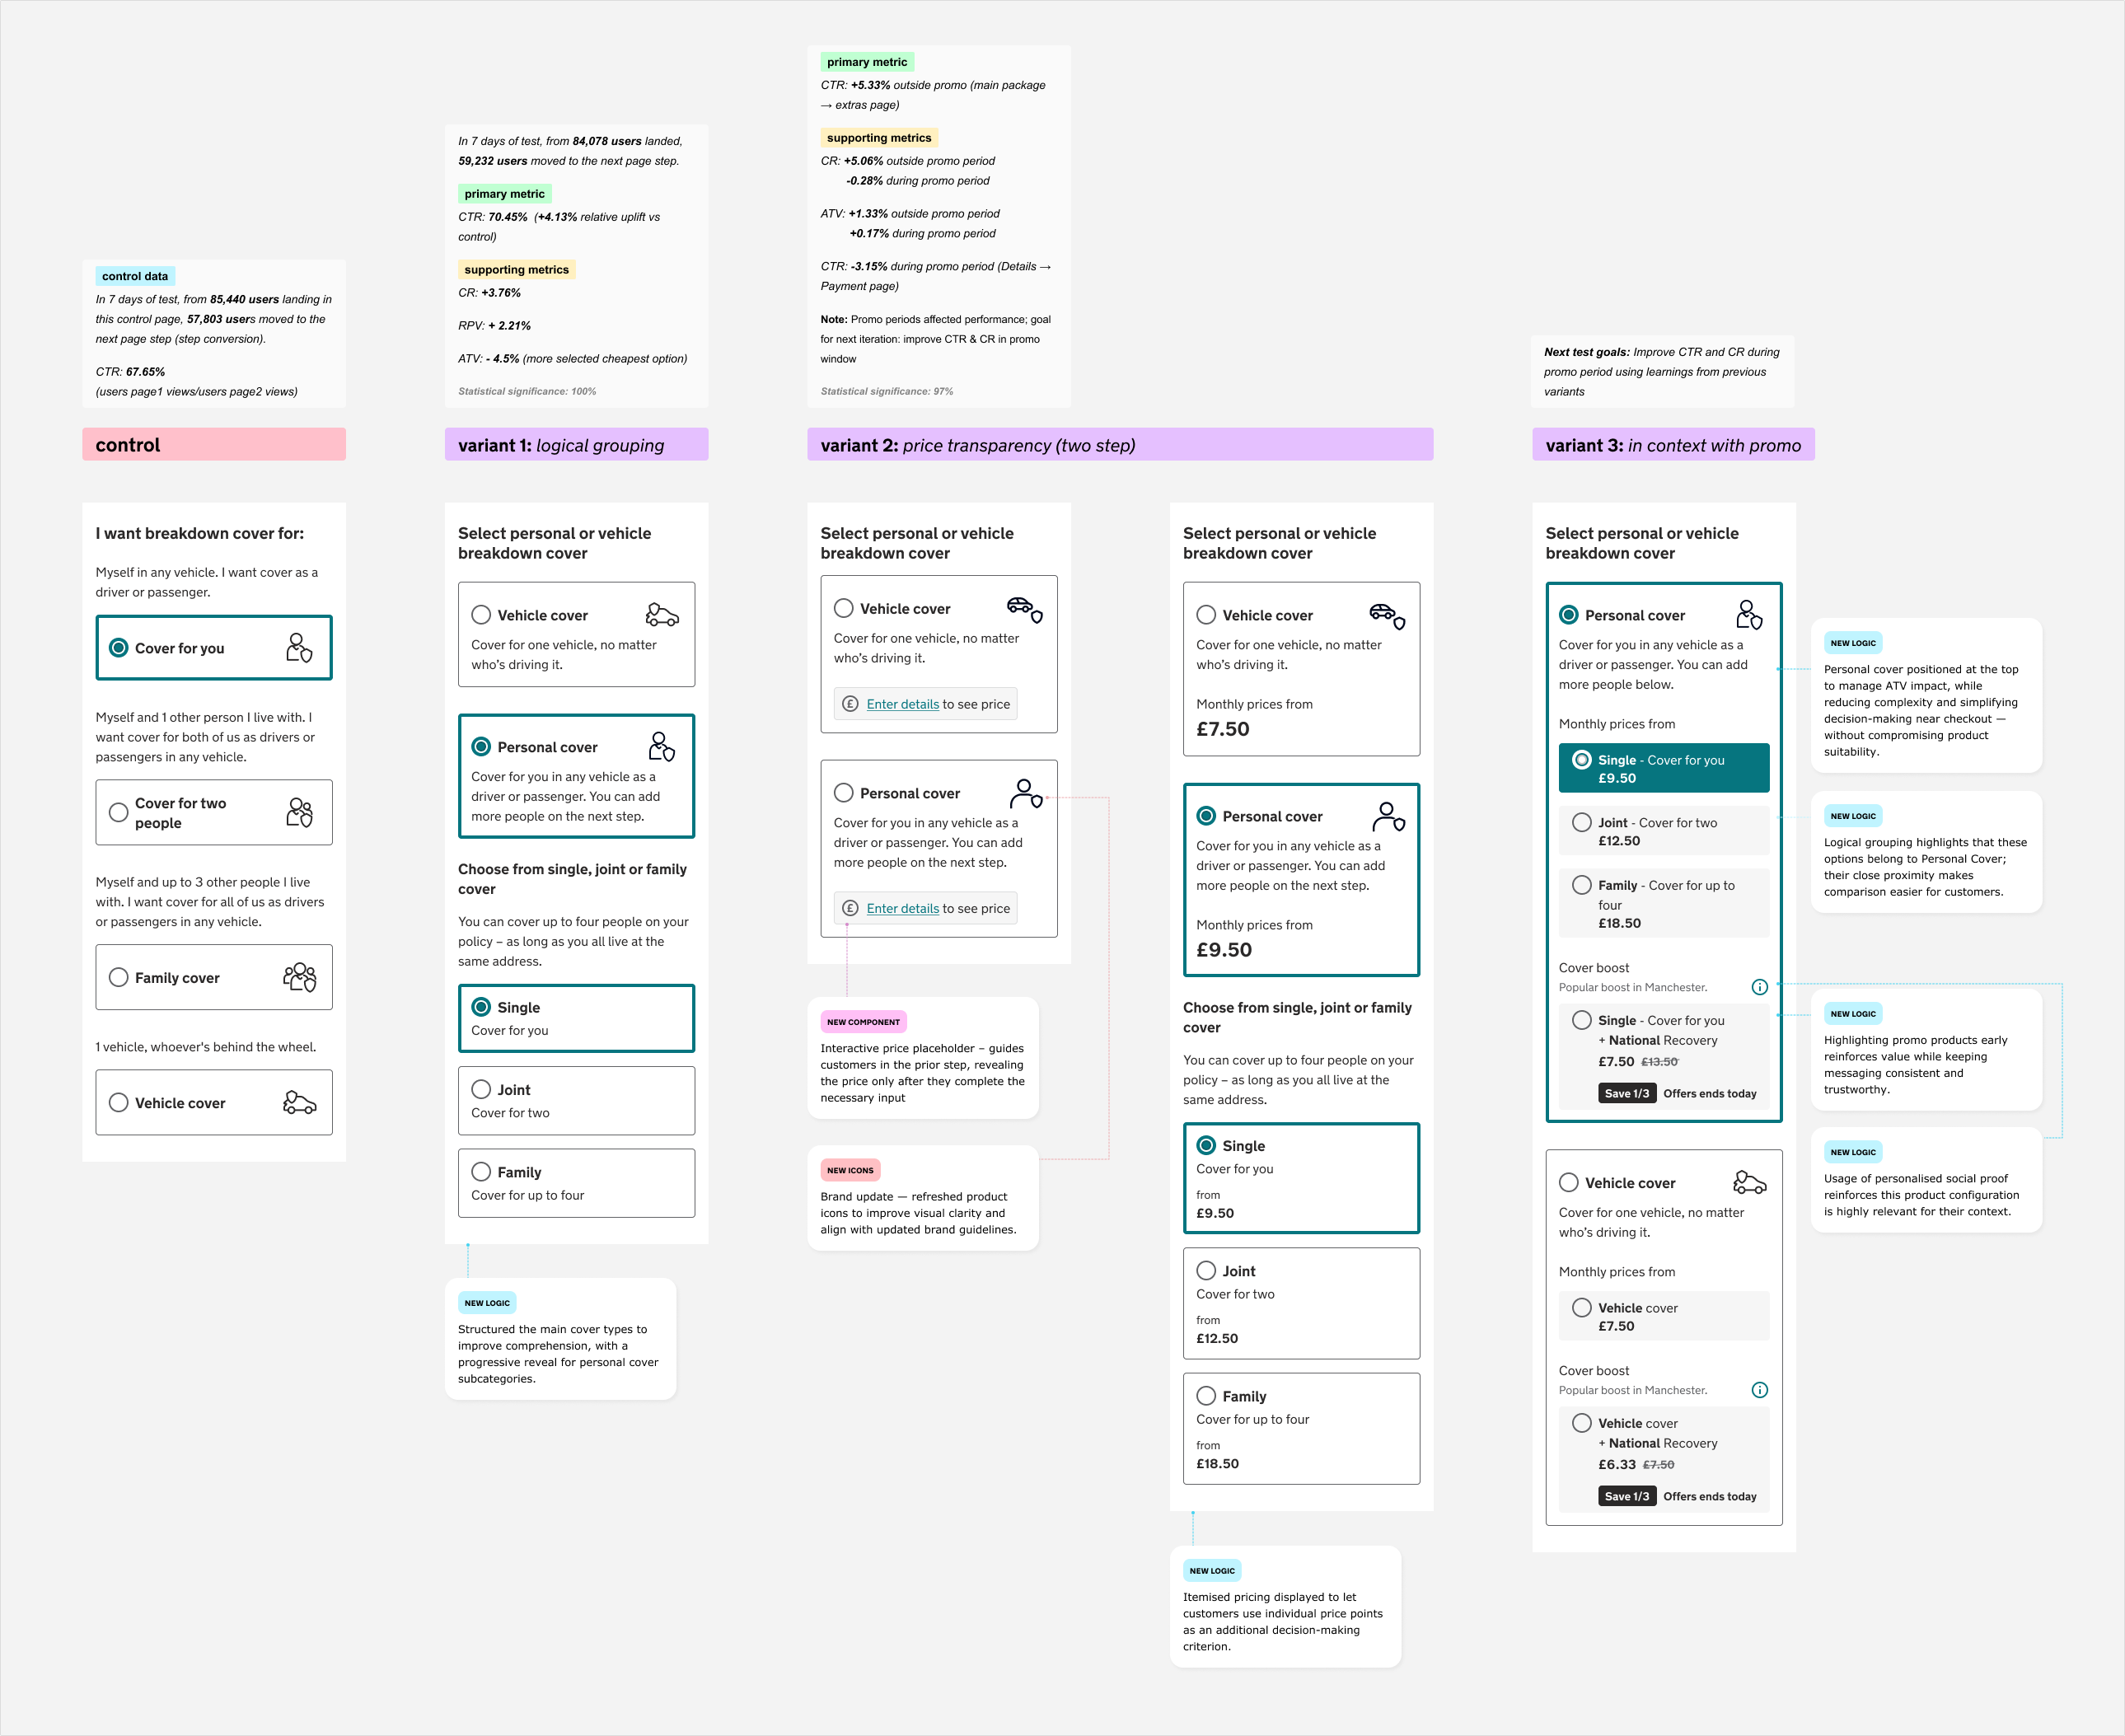
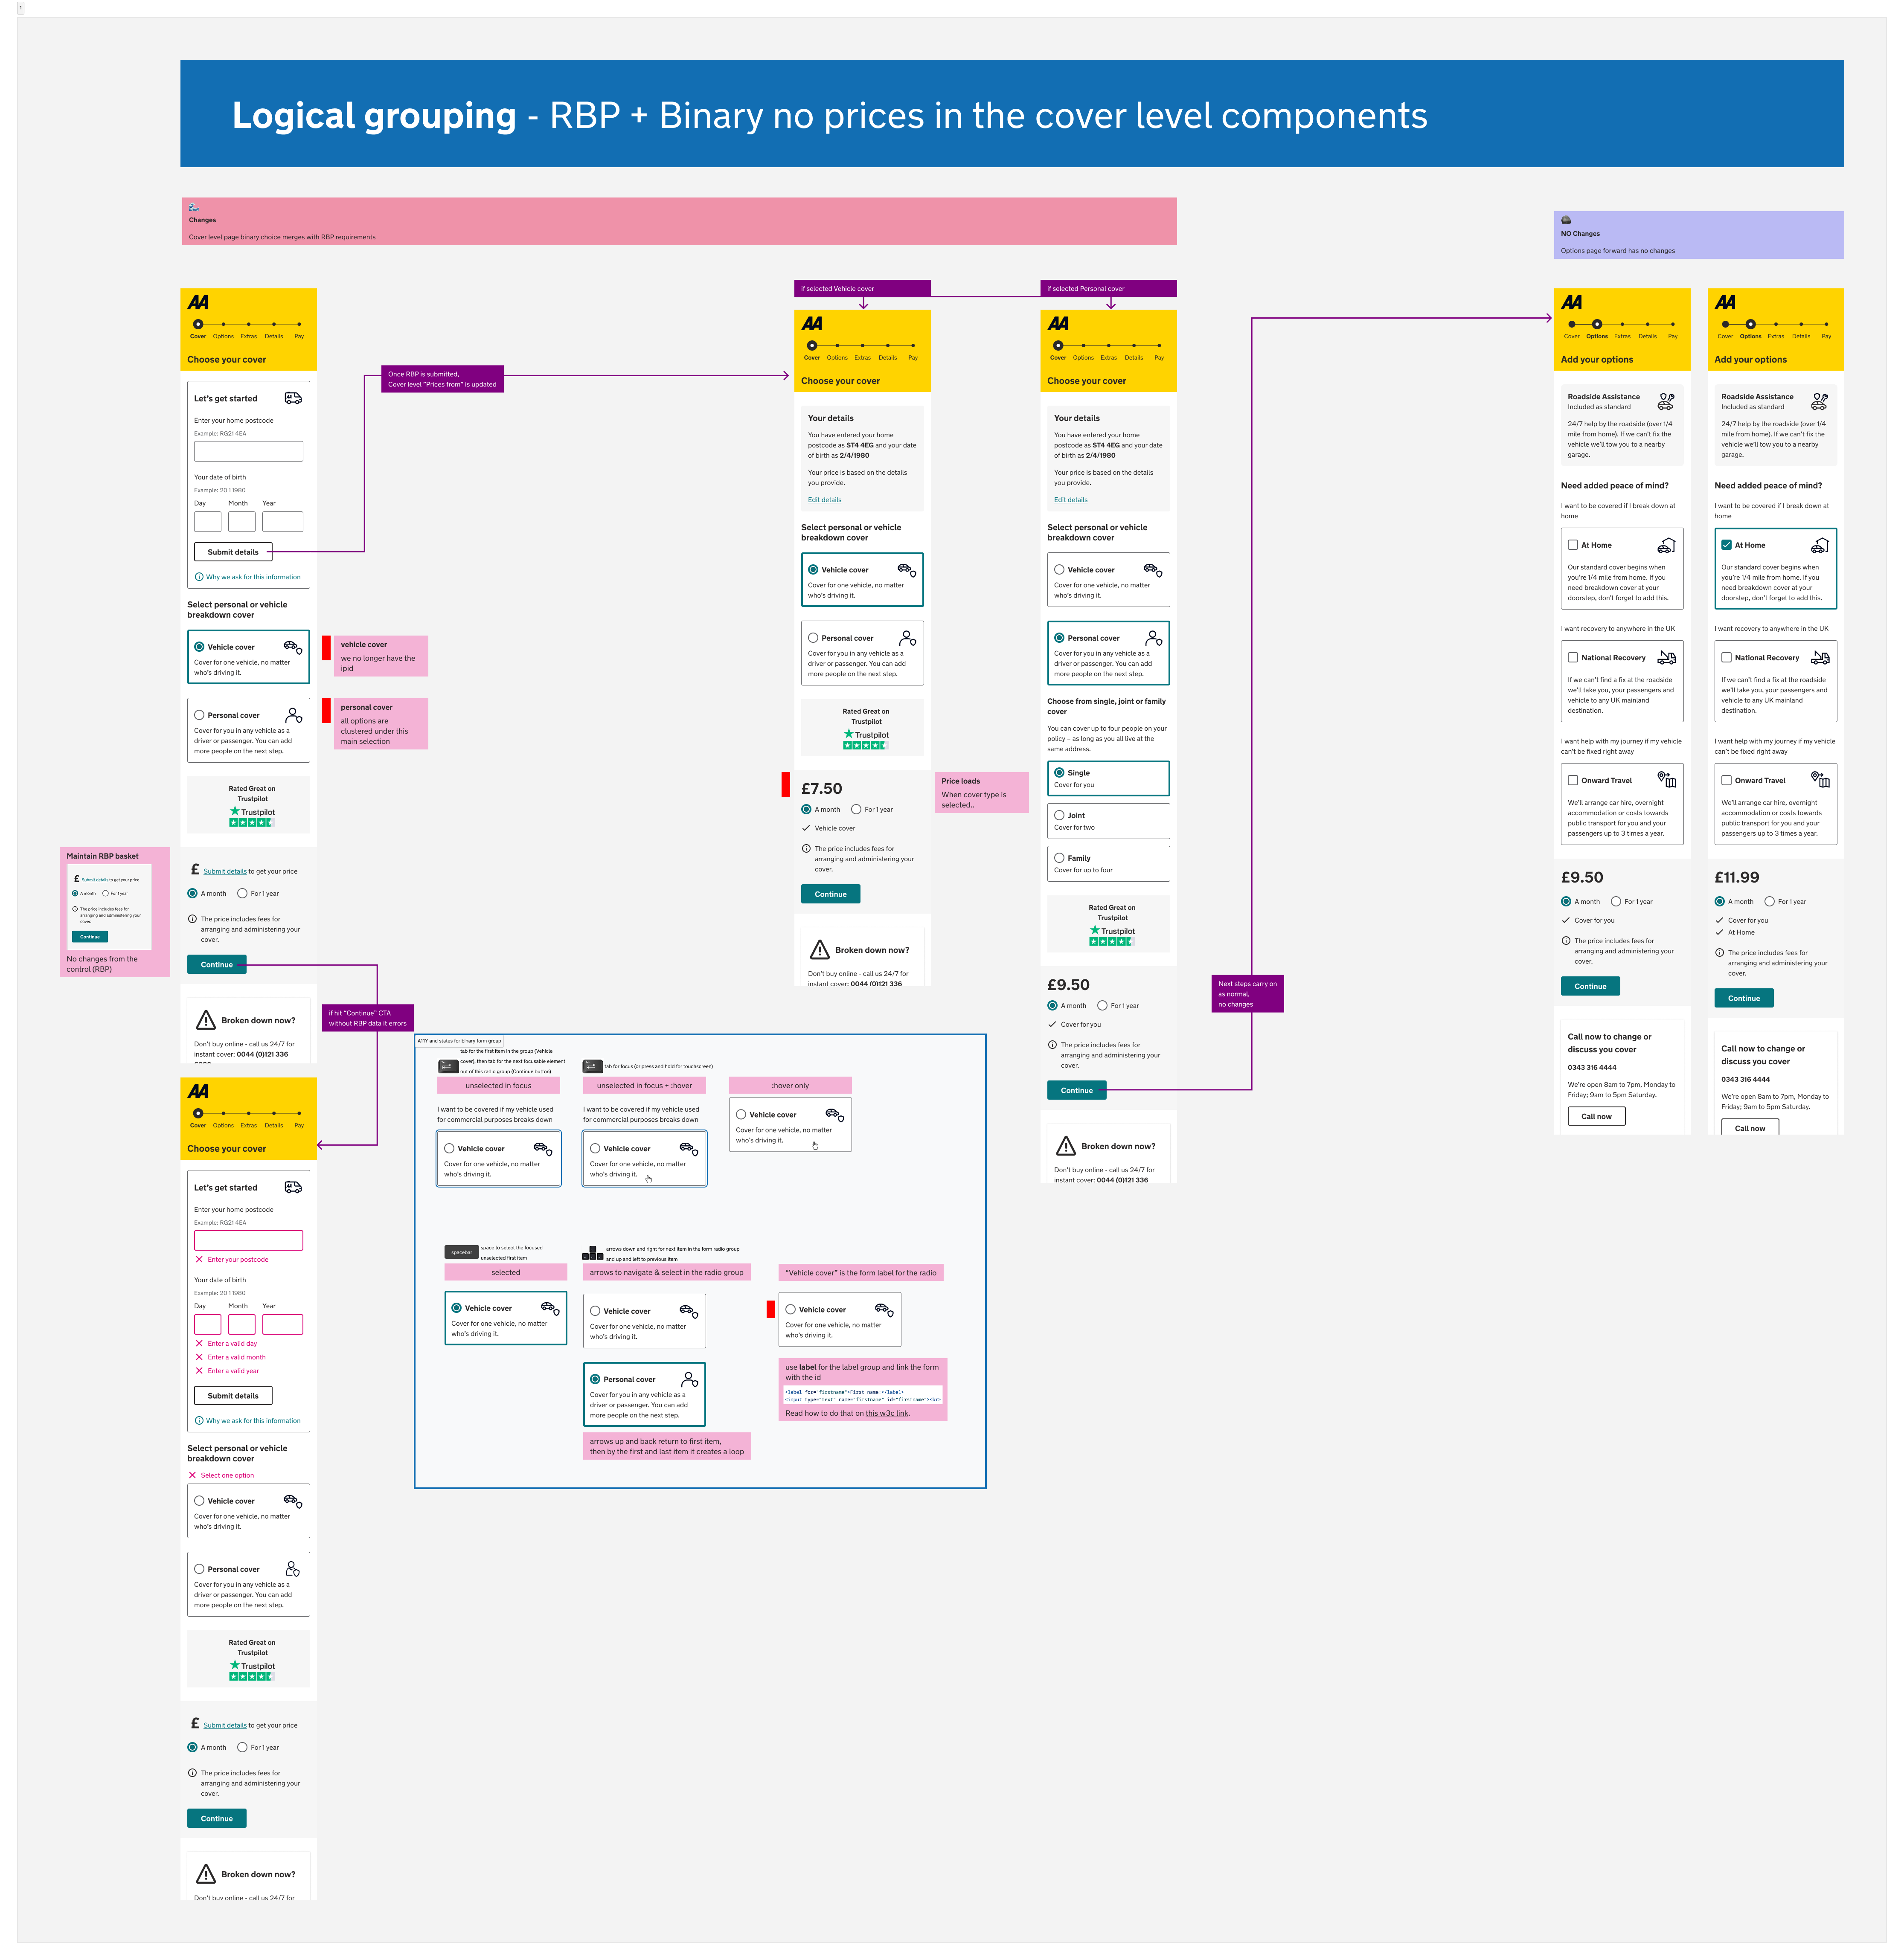
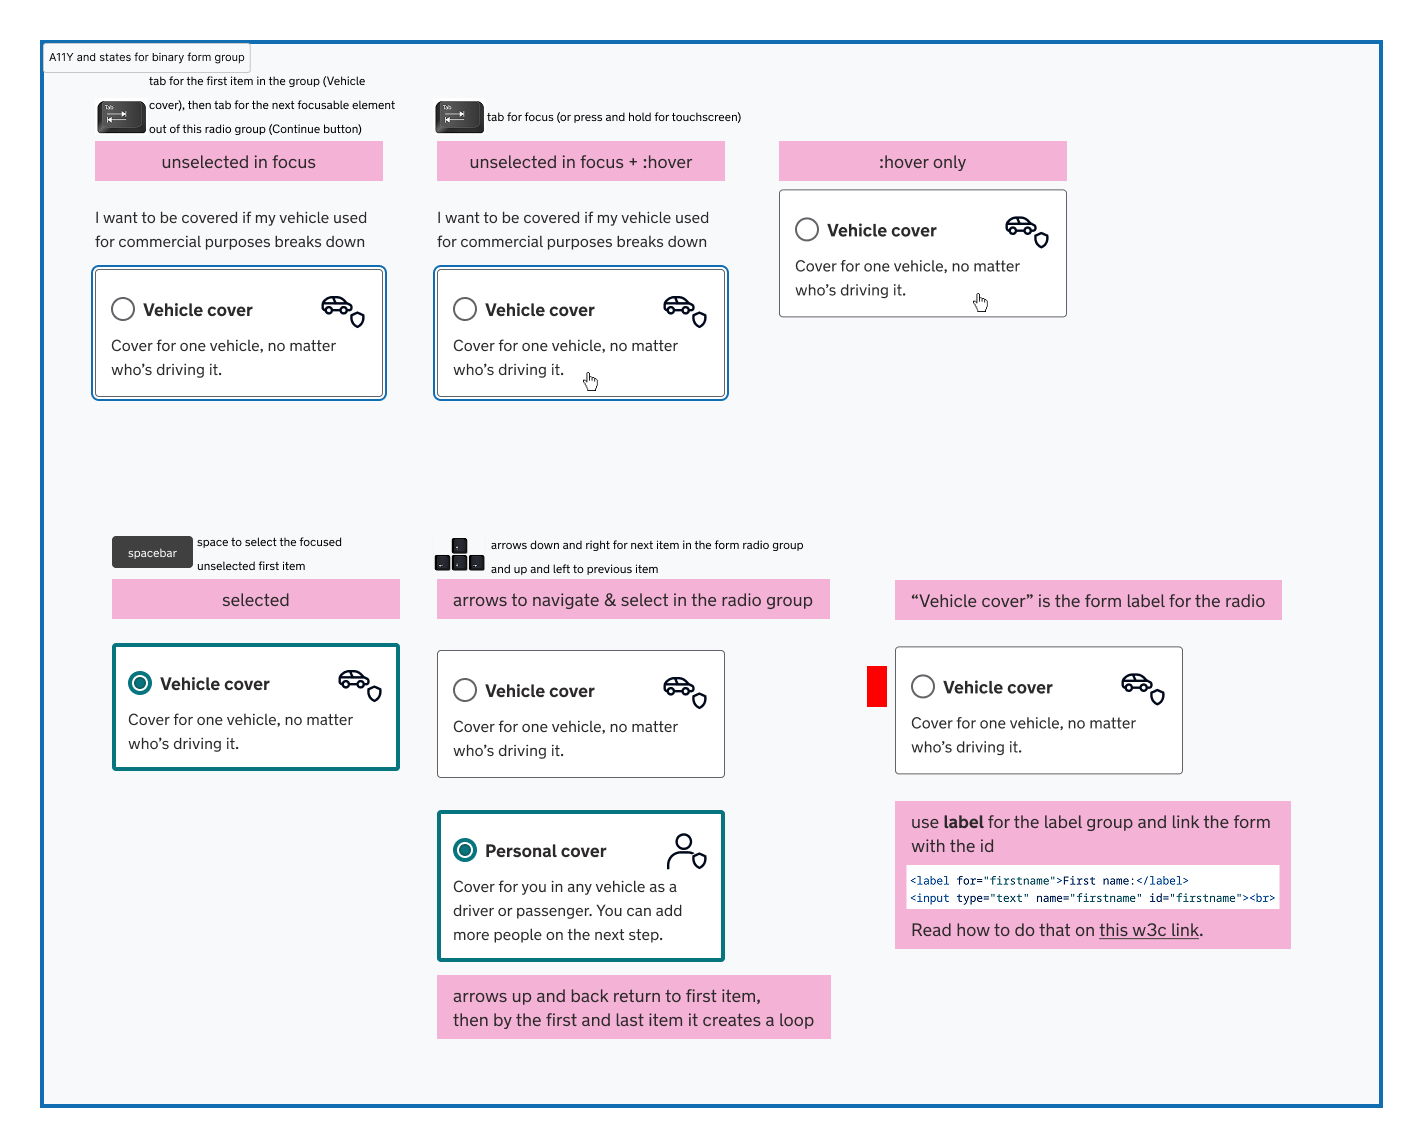
Decision #1: Logical grouping (iteration 1)
- Rationale: Customers were dropping off at cover level selection, indicating decision uncertainty. Logical grouping was tested to reduce cognitive load and improve comprehension.
- Trade-offs: Minor design deviation to measure lift without full redesign.
- Outcome: The variant delivered a relative +4.13% CTR uplift vs control. Post-test analysis showed continued confusion around price presentation, which informed the hypothesis for the next iteration.
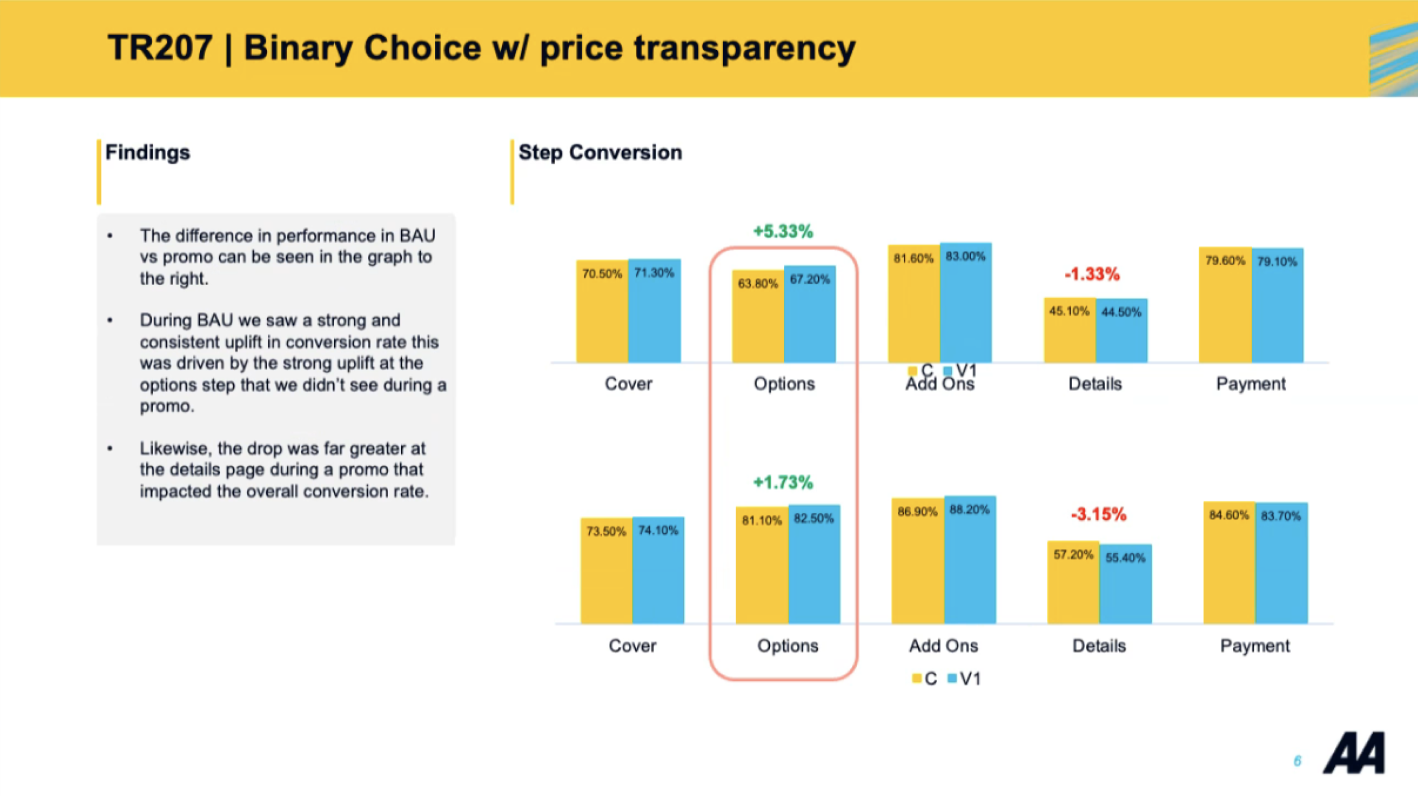
Decision #2: Price transparency (iteration 2)
- Rationale: Learnings from iteration 1 revealed price comprehension as the primary remaining blocker. This iteration tested clearer price proximity and presentation.
- Trade-offs: Known friction remained within the personal cover subcategory to isolate the impact of price proximity on cover type selection.
- Outcome: Outside of the promotional periods, clearer price presentation delivered a relative +5.33% CTR uplift. Results indicated that discount visibility during promotions required further optimisation.
Evidence that shaped the work
These snapshots capture the moments where evidence shaped direction—showing how data, user behaviour, and design judgement were combined to guide low-risk, high-impact experimentation.
Metrics Used for Decision-Making
The experiments were evaluated using a small set of shared metrics agreed with analytics and engineering. Each metric served a specific purpose in understanding user behaviour, managing commercial risk, and ensuring decisions were made at sufficient statistical confidence
Primary metric — Click-Through Rate (CTR)
- Measured progression at the cover type selection step, acting as the primary signal of decision clarity at a critical mid-funnel moment.
- Chosen to isolate user intent while reducing noise from downstream variables such as payment behaviour, promotions, and traffic mix.
Supporting metrics — Funnel and revenue health
- Conversion Rate (CR): Monitored to ensure improvements in CTR did not negatively affect completed purchases.
- Average Transaction Value (ATV): Observed directionally to understand whether changes in price presentation influenced purchase value.
- Revenue Per Visitor (RPV): Used as a commercial sense-check to validate that improved funnel progression aligned with overall revenue performance.
Statistical confidence and decision thresholds
- Set a minimum statistical confidence threshold (≥90%) before acting on any results; tests ran until this threshold was reached within the planned test window.
- Acted on results only after sufficient traffic volume reduced false positives and seasonal bias.
- Where confidence was not met, variants were treated as learnings rather than wins and informed subsequent hypotheses instead of being shipped.
Impact
Beyond the uplift, this work helped teams trust experimentation as a way to make progress without gambling the funnel.
Primary Results (Experiment Metrics)
- Relative +4.1% to +5.3% CTR uplift vs control
- Results were statistically significant (≥97%) across two iterations
Secondary Indicators (Observed Effects)
- Conversion rate uplift observed post-click, confirming downstream funnel health.
- ATV and RPV were monitored as commercial guardrails rather than primary optimisation targets, ensuring improvements in decision clarity did not introduce misaligned or pressured purchasing behaviour.
Qualitative Outcomes
- Improved alignment between design, engineering, and analytics
- Faster decision-making through shared experiment readouts
- Shift towards hypothesis-led optimisation in funnel design
Learnings & Influence
Learnings
- Iterative testing allows fast validation without large redesigns.
- Early assumptions can be invalidated; testing is critical.
- Continuous measurement ensures learnings are actionable.
- Optimisation requires balancing funnel efficiency with customer clarity, not maximising a single metric in isolation.
Influence
- Coordinated product, engineering, analytics, and design to enable rapid, low-risk experimentation with shared ownership of outcomes.
- Documented experiment rationale, results, and learnings to create a reusable knowledge base for future CRO initiatives.
- Used data and experimentation learnings to influence decisions around commercial guardrails, recognising when further iteration on ATV would add complexity without materially improving customer outcomes.
- Used this case study to mentor junior designers on hypothesis-driven experimentation, ethical optimisation, and balancing commercial goals with Consumer Duty responsibilities.